Fig. 9
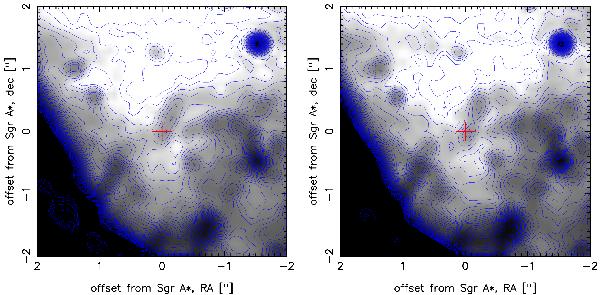
Two images at 8.6 μm, reconstructed from subsets of the May 2007 data. Each image is based on a different set of 4000 frames, corresponding to an on-source integration time of 80 s during an interval of about 19 min. The location of Sgr A* is marked by a red cross. The apparent variability of some of the extended features is caused by the low S/N of these images. The contours are as in Fig. 2.
Current usage metrics show cumulative count of Article Views (full-text article views including HTML views, PDF and ePub downloads, according to the available data) and Abstracts Views on Vision4Press platform.
Data correspond to usage on the plateform after 2015. The current usage metrics is available 48-96 hours after online publication and is updated daily on week days.
Initial download of the metrics may take a while.