Fig. 8
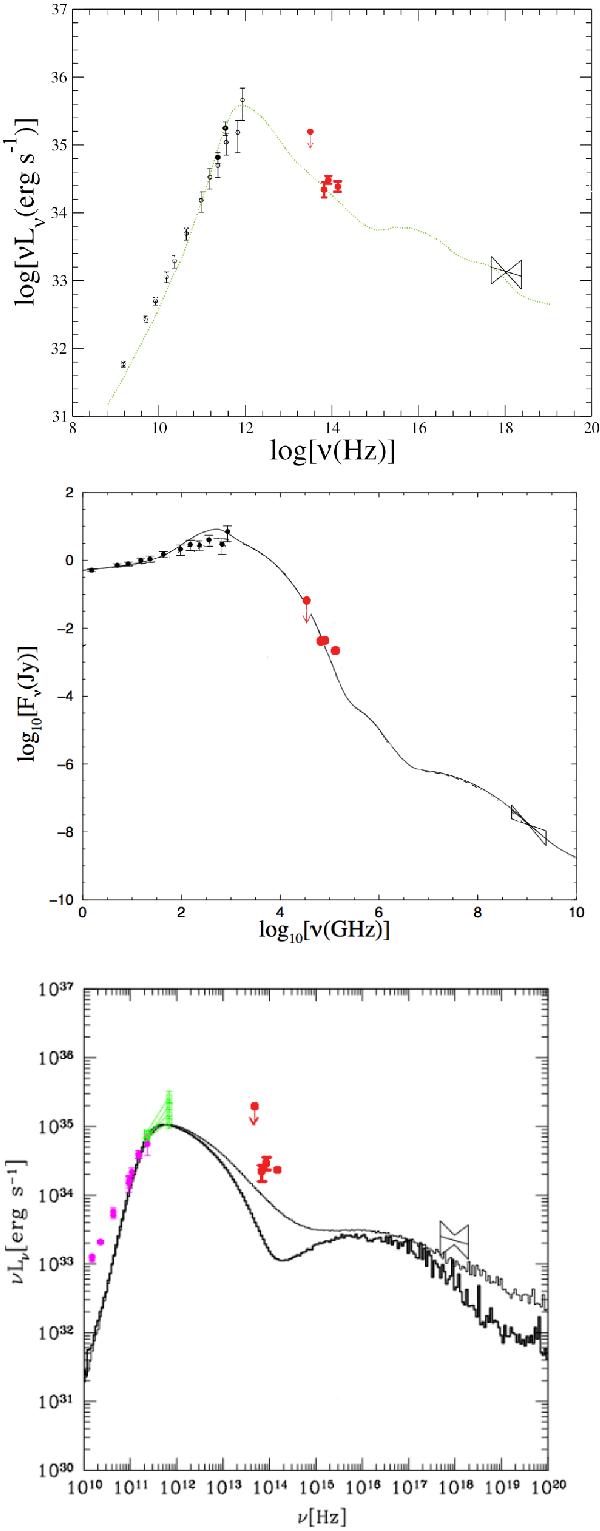
SED models for the quiescent or mean emission from Sgr A*. Top: RIAF model by Yuan et al. (2004). Middle: jet-ADAF model by Yuan et al. (2002). Bottom: SED from a general relativistic magnetohydrodynamics simulation by Mościbrodzka et al. (2009, their “best-bet” model is shown), where the thin line is the average SED and the thick line represents the SED at a given moment during the simulations. The upper limit at 8.59 μm is indicated by a down-pointing red arrow, the mean flux densities at 4.8, 3.8 and 2.1 μm are shown as red dots with error bars, which correspond to the standard deviation of the observed variability between epochs. For details on the models and radio/mm/X-ray data, see the referenced publications.
Current usage metrics show cumulative count of Article Views (full-text article views including HTML views, PDF and ePub downloads, according to the available data) and Abstracts Views on Vision4Press platform.
Data correspond to usage on the plateform after 2015. The current usage metrics is available 48-96 hours after online publication and is updated daily on week days.
Initial download of the metrics may take a while.