Free Access
Fig. 5
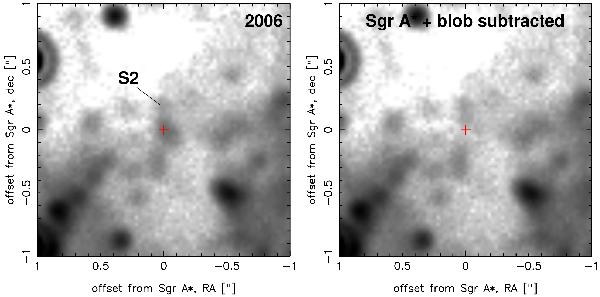
Left: average M′-image from 2006 data. Right: the same image, after subtraction of two point sources, one at the position of Sgr A* and one ~0.094″ to the SE of Sgr A*. The position of Sgr A* is indicated by a red cross.
Current usage metrics show cumulative count of Article Views (full-text article views including HTML views, PDF and ePub downloads, according to the available data) and Abstracts Views on Vision4Press platform.
Data correspond to usage on the plateform after 2015. The current usage metrics is available 48-96 hours after online publication and is updated daily on week days.
Initial download of the metrics may take a while.