Fig. 4
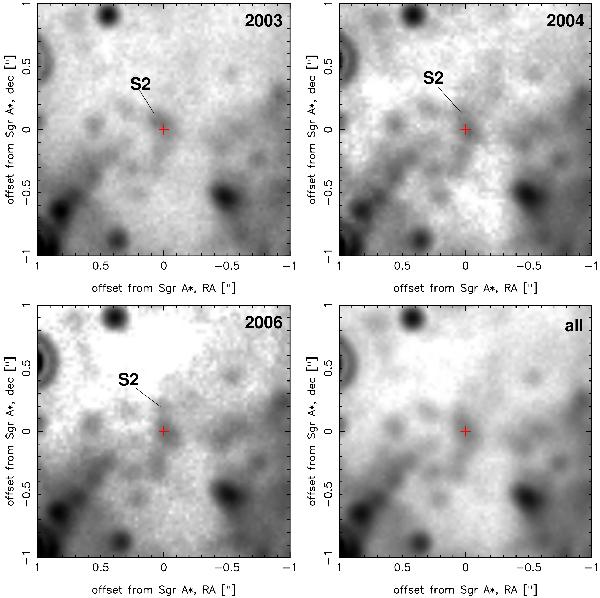
The surroundings of Sgr A* seen with NaCo in the M′-band. Upper left: average image from 2003 data. Upper right: average image from 2004 data. Lower left: average image from 2006 data. Lower right: average image from 2003–2006 data. Sgr A* is marked with a red cross. The fast-moving star S2 is marked in the 2003, 2004, and 2006 images. The gray scale is logarithmic.
Current usage metrics show cumulative count of Article Views (full-text article views including HTML views, PDF and ePub downloads, according to the available data) and Abstracts Views on Vision4Press platform.
Data correspond to usage on the plateform after 2015. The current usage metrics is available 48-96 hours after online publication and is updated daily on week days.
Initial download of the metrics may take a while.