Fig. 3
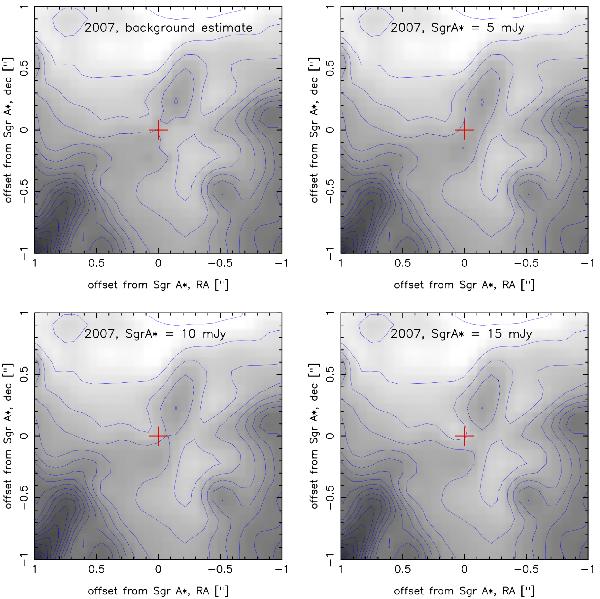
Zoom onto Sgr A* at 8.6 μm in the image reconstructed with the speckle holography algorithm from all burst mode observations in 2007. North is up and East is to the left. Contour lines are identical to the ones in Fig. 2. Sgr A* is marked with a cross of 0.075″ line segments. Upper left panel: estimate of the diffuse background emission at the position of Sgr A*. A point source of 5, 10, and 15 mJy was subtracted from the original reconstructed image at the position of Sgr A* with the results shown in the upper right, lower left, and lower right panels, respectively.
Current usage metrics show cumulative count of Article Views (full-text article views including HTML views, PDF and ePub downloads, according to the available data) and Abstracts Views on Vision4Press platform.
Data correspond to usage on the plateform after 2015. The current usage metrics is available 48-96 hours after online publication and is updated daily on week days.
Initial download of the metrics may take a while.