Fig. 2
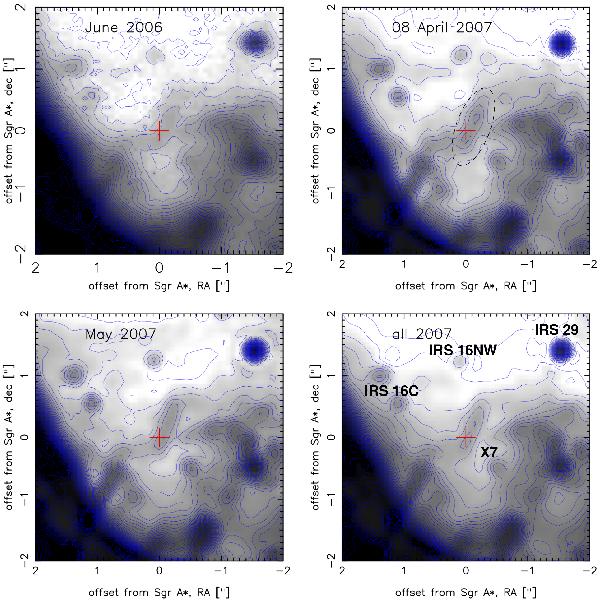
The surroundings of Sgr A* at 8.6 μm. Upper left: image from long-exposure observations on 5 June 2006. Upper right: image reconstructed with the speckle holography algorithm from burst mode observations on 8 April 2007. Lower left: image reconstructed with the speckle holography algorithm from burst mode observations on 22 and 23 May 2007. Lower right: image reconstructed with the speckle holography algorithm from all burst mode observations in 2007. North is up and East is to the left. Contour lines are plotted in steps of 0.5 mJy from 0.5 to 20 mJy per pixel (one pixel corresponds to 0.075″ × 0.075″). Sgr A* is marked with a red cross of 0.3″ line segments. The stellar sources IRS16 NW, IRS16 C, and IRS29, as well as the cometary shaped source X7 (Mužić et al. 2010) are labeled in the lower right panel. The Sgr A*-Ridge is marked by a dashed ellipse in the upper right panel.
Current usage metrics show cumulative count of Article Views (full-text article views including HTML views, PDF and ePub downloads, according to the available data) and Abstracts Views on Vision4Press platform.
Data correspond to usage on the plateform after 2015. The current usage metrics is available 48-96 hours after online publication and is updated daily on week days.
Initial download of the metrics may take a while.