Fig. 11
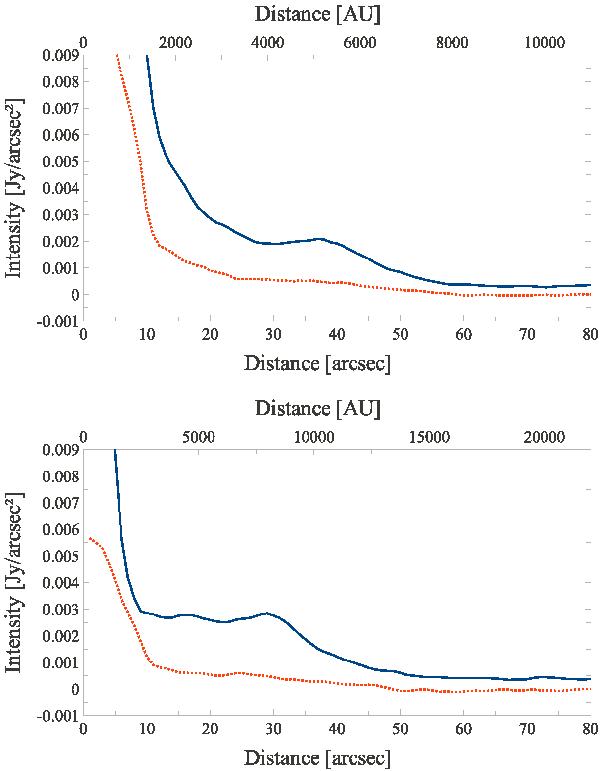
Intensity plots for X Her and TX Psc. Upper plot: integrated intensity of X Her in the direction of the northern blob (PA: − 7° to − 17°) from the image of Fig. 4. Lower plot: integrated intensity for TX Psc in direction of the blob/proper motion (PA: 228° to 250°), from the image of Fig. 5. In both plots the (blue) continuous curve corresponds to 70 μm, the (red) dashed curve to 160 μm. The distances used to convert the angular scales into distances in AU are listed in Table 1.
Current usage metrics show cumulative count of Article Views (full-text article views including HTML views, PDF and ePub downloads, according to the available data) and Abstracts Views on Vision4Press platform.
Data correspond to usage on the plateform after 2015. The current usage metrics is available 48-96 hours after online publication and is updated daily on week days.
Initial download of the metrics may take a while.