Fig. 10
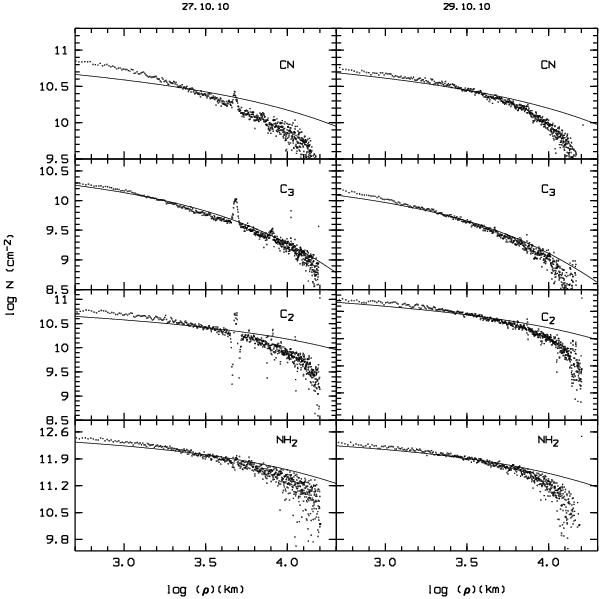
Observed gas column density profiles N in units of cm-2 versus the projected cometocentric distance ρ in log-log representation in 70° and in east direction for October 27 and 29, 2010, respectively. The best achievable fit obtained by means of the Haser modelling (Haser 1957) with parameters given in the text and production rates listed in Table 3 is plotted with solid lines.
Current usage metrics show cumulative count of Article Views (full-text article views including HTML views, PDF and ePub downloads, according to the available data) and Abstracts Views on Vision4Press platform.
Data correspond to usage on the plateform after 2015. The current usage metrics is available 48-96 hours after online publication and is updated daily on week days.
Initial download of the metrics may take a while.