Fig. 9
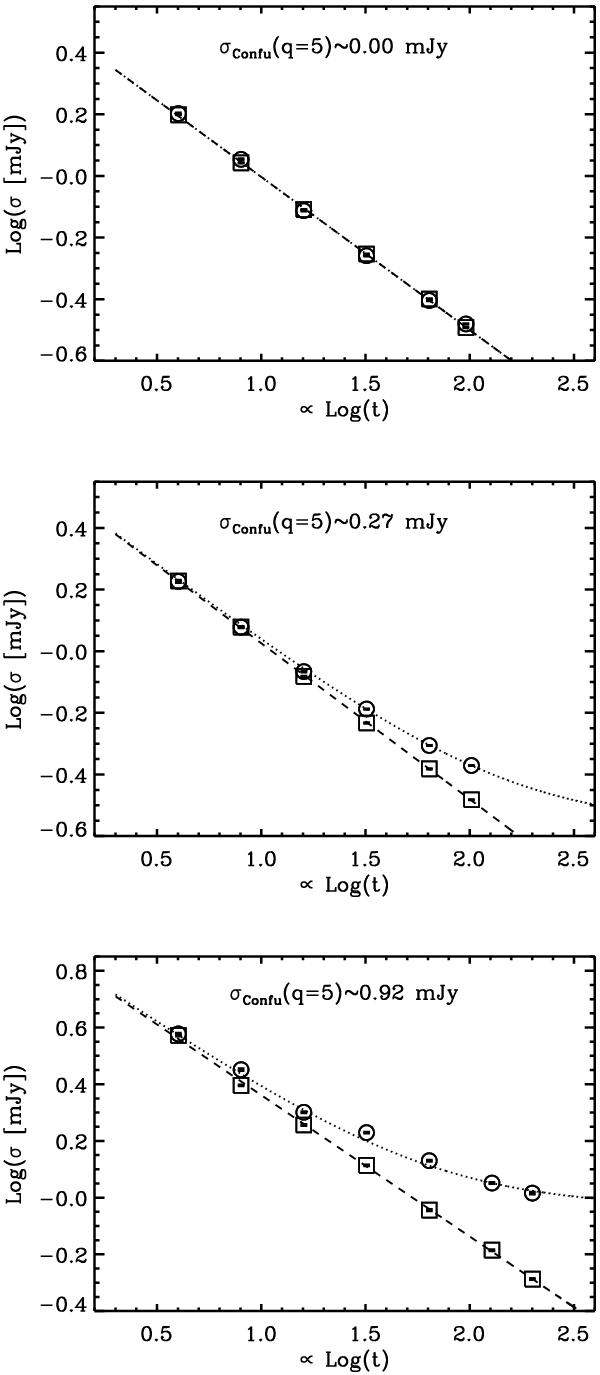
Noise in PACS GOODS-S maps at 70, 100, 160 μm (top, middle, bottom panels), as a function of exposure time. The dashed line represent the trend σI ∝ t-0.5 followed by instrumental noise; while the dotted line is σT obtained by summing σI and the confusion noise σc in quadrature. Squares mark the expected pure-instrumental noise at the exposure times considered, while circles denote the measured σT.
Current usage metrics show cumulative count of Article Views (full-text article views including HTML views, PDF and ePub downloads, according to the available data) and Abstracts Views on Vision4Press platform.
Data correspond to usage on the plateform after 2015. The current usage metrics is available 48-96 hours after online publication and is updated daily on week days.
Initial download of the metrics may take a while.