Free Access
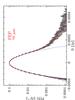
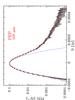
Fig. 8
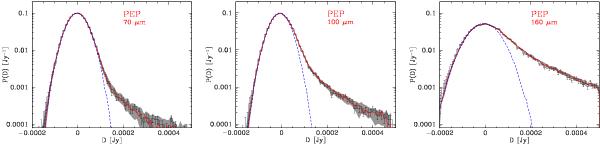
P(D) distributions in GOODS-S. The black histogram and error bars belong to the observed P(D), while the red solid line and grey shaded area represent the best fit and its 3σ confidence interval. The Gaussian noise contribution is depicted with blue dashed lines.
This figure is made of several images, please see below:
Current usage metrics show cumulative count of Article Views (full-text article views including HTML views, PDF and ePub downloads, according to the available data) and Abstracts Views on Vision4Press platform.
Data correspond to usage on the plateform after 2015. The current usage metrics is available 48-96 hours after online publication and is updated daily on week days.
Initial download of the metrics may take a while.