Fig. 6
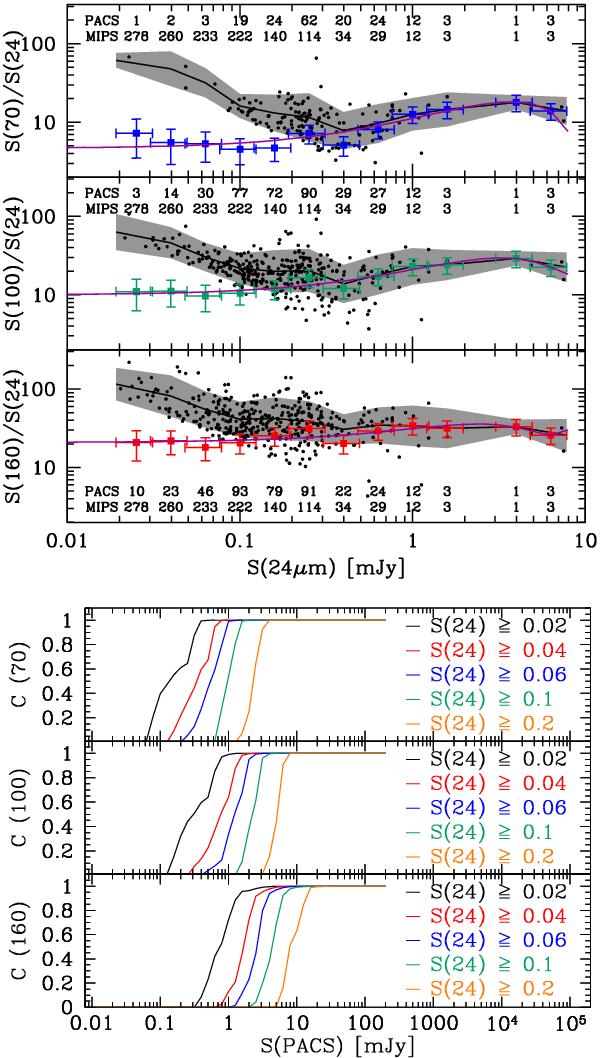
Stacking of 24 μm sources on PACS maps in GOODS-S. Top panel: PACS/24 μm colors of sources, as measured from individual detections (black dots) and detections+stacking (colored symbols). Black solid lines and grey shaded areas represent average colors and dispersion of PACS-detected sources. Solid purple lines are polynomial fits to the stacked points. For each 24 μm flux bin the number of sources detected by PACS and the total number of MIPS 24 μm objects are quoted. Bottom panel: completeness analysis, based on the Le Borgne et al. (2009) backward-evolution model; the quoted 24 μm fluxes are in [mJy] units.
Current usage metrics show cumulative count of Article Views (full-text article views including HTML views, PDF and ePub downloads, according to the available data) and Abstracts Views on Vision4Press platform.
Data correspond to usage on the plateform after 2015. The current usage metrics is available 48-96 hours after online publication and is updated daily on week days.
Initial download of the metrics may take a while.