Fig. 13
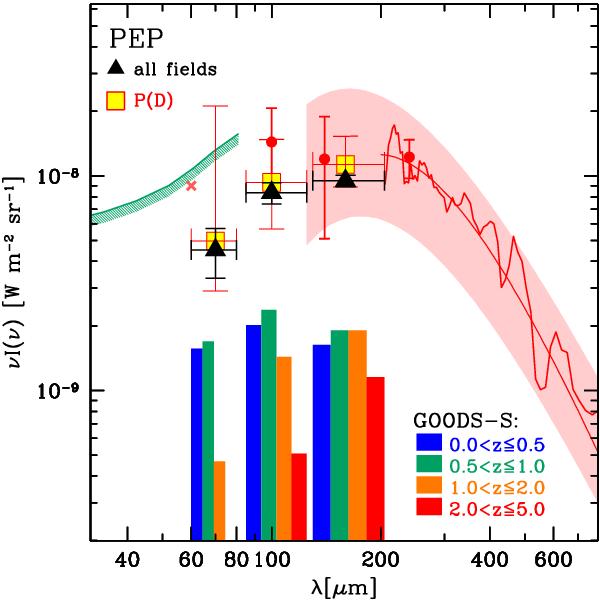
The cosmic infrared background. Black filled triangles represent the total CIB emitted above the PEP flux limits, based on resolved number counts in GOODS-S, GOODS-N, Lockman Hole and COSMOS, evaluated as described in Sect. 6.2. Yellow squares belong to the P(D) analysis in GOODS-S. Histograms denote the contribution of different redshift bins to the CIB, over the flux range covered by GOODS-S. Literature data include: DIRBE measurements (filled circles, 1σ errors, Dole et al. 2006), FIRAS spectrum (solid lines above 200 μm, Lagache et al. 1999, 2000), Fixsen et al. (1998) modified Black Body (shaded area), 60 μm IRAS fluctuation analysis (cross, Miville-Deschênes et al. 2002), and γ-ray upper limits (green hatched line below 80 μm Mazin & Raue 2007).
Current usage metrics show cumulative count of Article Views (full-text article views including HTML views, PDF and ePub downloads, according to the available data) and Abstracts Views on Vision4Press platform.
Data correspond to usage on the plateform after 2015. The current usage metrics is available 48-96 hours after online publication and is updated daily on week days.
Initial download of the metrics may take a while.