Fig. 12
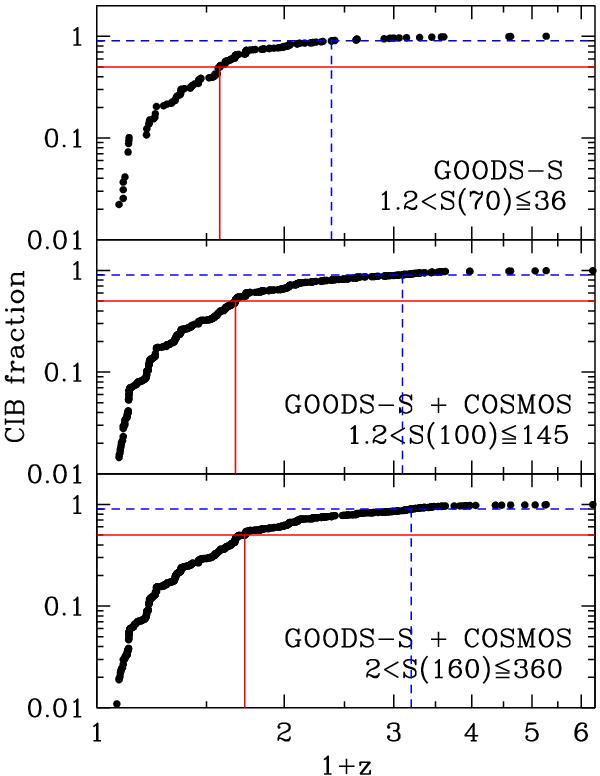
Cumulative CIB fraction as a function of redshift, as obtained summing the contribution of individual sources in GOODS-S and COSMOS, and accounting for completeness correction. Top, middle and bottom panels belong to the 70, 100, 160 μm bands, respectively. Red solid lines and dashed blue lines mark the 50th and 90th percentiles, i.e. identify the redshifts below which 50% and 90% of the detected CIB was emitted. Flux ranges covered by observations are quoted in each panel.
Current usage metrics show cumulative count of Article Views (full-text article views including HTML views, PDF and ePub downloads, according to the available data) and Abstracts Views on Vision4Press platform.
Data correspond to usage on the plateform after 2015. The current usage metrics is available 48-96 hours after online publication and is updated daily on week days.
Initial download of the metrics may take a while.