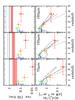
Fig. 11

Redshift distribution of CIB surface brightness, in GOODS-S (left) and COSMOS (right). Top panels depict the resolved fraction of CIB emitted at different epochs. The horizontal black lines (solid and dashed) represent the total value and its uncertainty (Dole et al. 2006; Miville-Deschênes et al. 2002). The red horizontal lines and shaded areas belong to the fraction resolved into individual sources (plus completeness correction) by PEP. Bottom panels: redshift derivative, compared to available models (Gruppioni et al. 2011; Marsden et al. 2010; Béthermin et al. 2011; Valiante et al. 2009; Le Borgne et al. 2009; Rowan-Robinson 2009). See Fig. 5 for model lines notation.
Current usage metrics show cumulative count of Article Views (full-text article views including HTML views, PDF and ePub downloads, according to the available data) and Abstracts Views on Vision4Press platform.
Data correspond to usage on the plateform after 2015. The current usage metrics is available 48-96 hours after online publication and is updated daily on week days.
Initial download of the metrics may take a while.