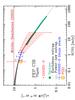
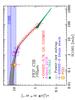
Fig. 10
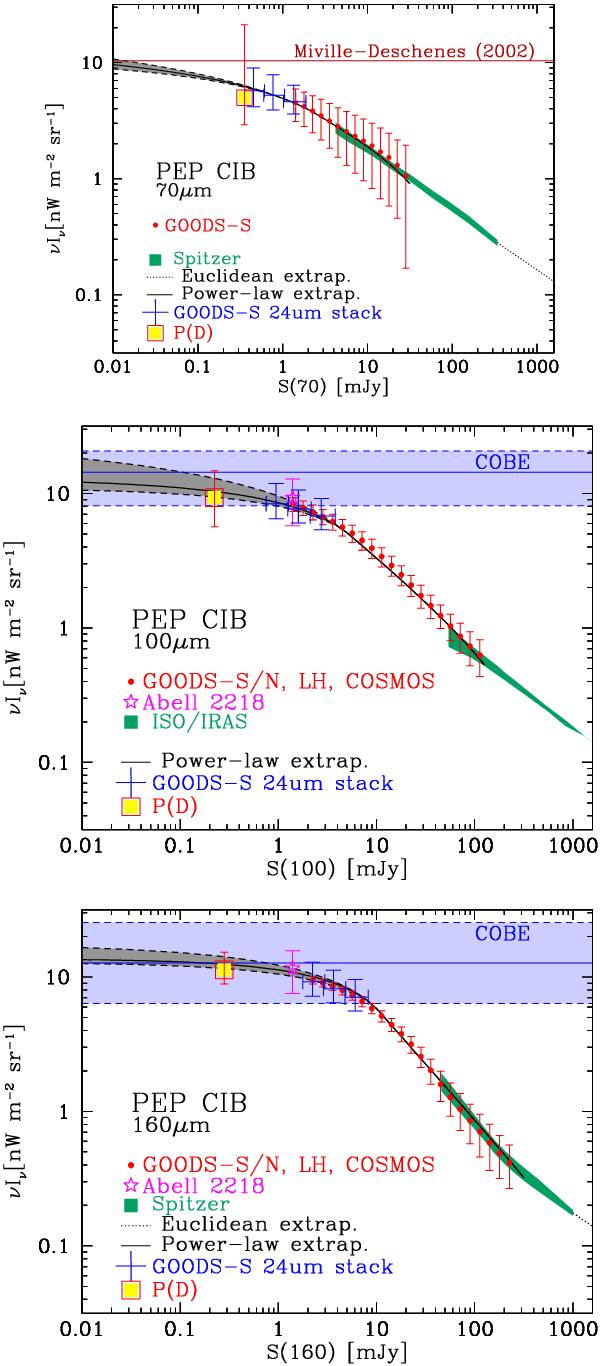
Cumulative CIB as a function of flux. Red circles, blue crosses and the yellow square belong to completeness-corrected counts, stacking and P(D) analysis, respectively. The black line solid and grey shaded area are based on power-law fit to the resolved number counts. The star symbol indicates the CIB derived from gravitational lensing in Abell 2218 (Altieri et al. 2010). The horizontal lines and shades mark the reference direct measurements of the CIB by Dole et al. (2006, at 100 and 160 μm, including 1σ and Miville-Deschênes et al. (2002, at 70 μ. The green shaded area belongs to previous surveys carried out with IRAS, ISO and Spitzer (Oliver et al. 1992; Bertin et al. 1997; Efstathiou et al. 2000; Rowan-Robinson et al. 2004; Rodighiero & Franceschini 2004; Héraudeau et al. 2004). At the very bright end, an Euclidean extrapolation is used (dotted lines).
Current usage metrics show cumulative count of Article Views (full-text article views including HTML views, PDF and ePub downloads, according to the available data) and Abstracts Views on Vision4Press platform.
Data correspond to usage on the plateform after 2015. The current usage metrics is available 48-96 hours after online publication and is updated daily on week days.
Initial download of the metrics may take a while.