Fig. 9
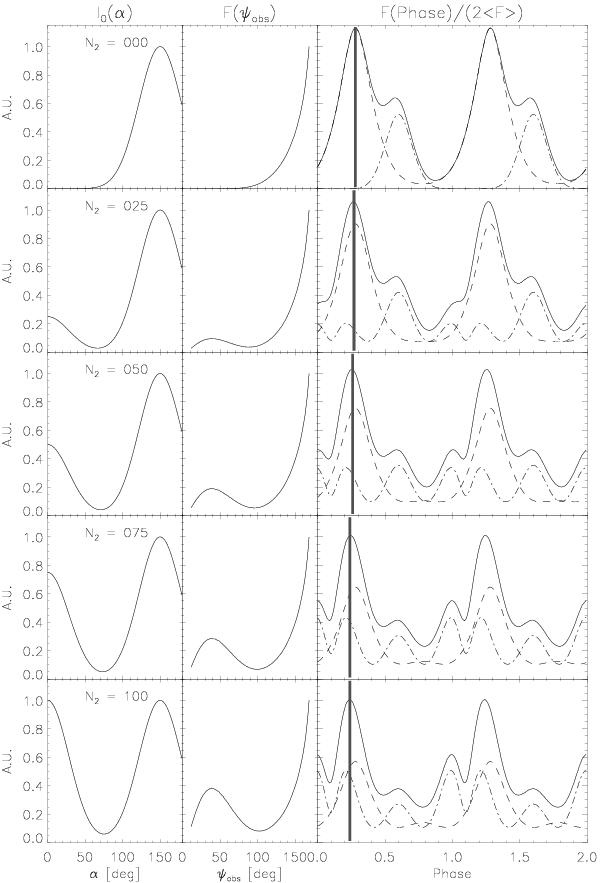
Left panels: intrinsic beam patterns (arbitrary units) emerging from the lateral walls of the NS accretion column as a function of the angle α with respect to the local radial direction. The function is the sum of two Gaussians as described in Eq. (A.9). The value of the normalization of the upward Gaussian is indicated in each plot (N2). Central panels: asymptotic beam patterns (arbitrary units normalized to the values at 170 degrees) as a function of the angle ψobs between the axis of the accretion column and the line of sight to the observer. The beams are computed by assuming an accretion column with a semi-aperture of 4 degrees, and extended for 2 km above the surface of a neutron star with a mass of 1.4 M⊙ and a radius of 10 km. Right panels: synthetic pulse profiles computed for the geometry in 4U 0115 + 63 described in Sect. 4. The solid line corresponds to the total flux divided by two times its averaged value for plotting purposes. The dashed line represents the contribution from the farther pole from the line of sight to the observer, while the dot-dashed line indicates the contribution from the other pole. The gray vertical band corresponds to the location in phase of the pulse maximum. A leftward shift in phase is emerging while increasing the value of N2.
Current usage metrics show cumulative count of Article Views (full-text article views including HTML views, PDF and ePub downloads, according to the available data) and Abstracts Views on Vision4Press platform.
Data correspond to usage on the plateform after 2015. The current usage metrics is available 48-96 hours after online publication and is updated daily on week days.
Initial download of the metrics may take a while.