Fig. 7
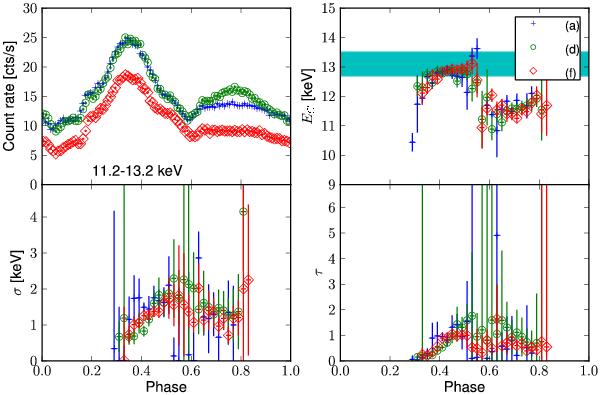
Phase-resolved study of the fundamental absorption line for the BeppoSAX observations. Blue points correspond to observation (a), green circles to observation (d), and red diamonds to observation (f). Upper left: pulse profiles extracted in the energy range 11.2–13.2 keV (shifted in phase to be aligned). Upper right: centroid energy of the first cyclotron harmonic. The horizontal cyan band is the energy range of the most negative phase shift of the main peak measured from the SAX data. Lower left: amplitude of the line. Lower right: optical depth of the line.
Current usage metrics show cumulative count of Article Views (full-text article views including HTML views, PDF and ePub downloads, according to the available data) and Abstracts Views on Vision4Press platform.
Data correspond to usage on the plateform after 2015. The current usage metrics is available 48-96 hours after online publication and is updated daily on week days.
Initial download of the metrics may take a while.