Fig. 5
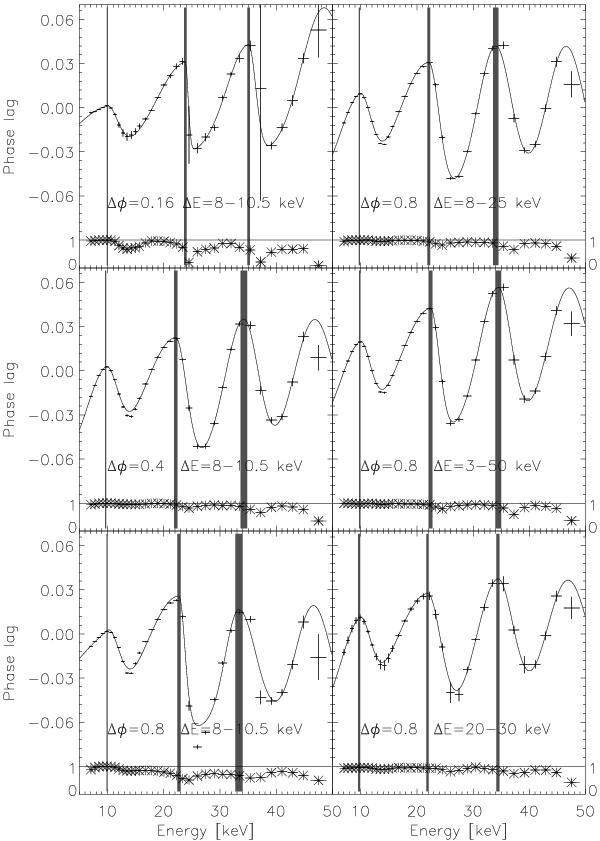
Phase shifts measured from the observation (b) by using a different range of phases than adopted for the analysis in Fig. 4 to compute the shifts (Δφ) and a different energy range of the reference pulse profile (ΔE). Specific values of these parameters are indicated in different panels. The shaded intervals represent the centroid energy of the asymmetric Gaussians used to describe the lags with the 1σ uncertainty. The solid line is the best-fit function of the phase lags.
Current usage metrics show cumulative count of Article Views (full-text article views including HTML views, PDF and ePub downloads, according to the available data) and Abstracts Views on Vision4Press platform.
Data correspond to usage on the plateform after 2015. The current usage metrics is available 48-96 hours after online publication and is updated daily on week days.
Initial download of the metrics may take a while.