Fig. 4
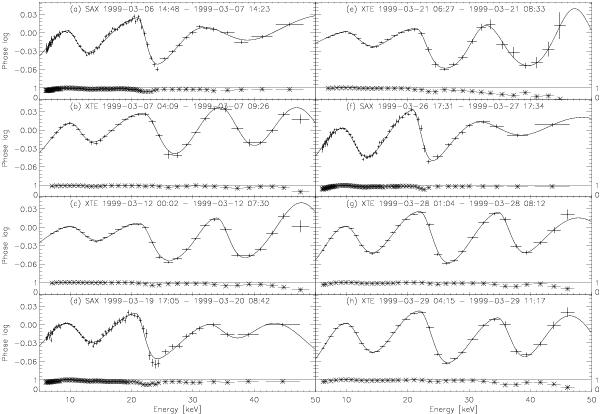
Phase lags of the main peak in normalized phase units (points) and linear correlation coefficients (stars) as a function of energy. We considered here BeppoSAX data from the MECS (2–8.5 keV), the HPGSPC (8.5–25 keV), and the PDS (>25 keV). RXTE data are from the PCA (3–45 keV) and the HEXTE-B (>45 keV). The correlation function is computed on a phase interval of 0.4 phase units, centered on the maximum of the reference pulse profiles. The solid line represents the best-fit function to the phase lags (see text for the details).
Current usage metrics show cumulative count of Article Views (full-text article views including HTML views, PDF and ePub downloads, according to the available data) and Abstracts Views on Vision4Press platform.
Data correspond to usage on the plateform after 2015. The current usage metrics is available 48-96 hours after online publication and is updated daily on week days.
Initial download of the metrics may take a while.