Fig. 2
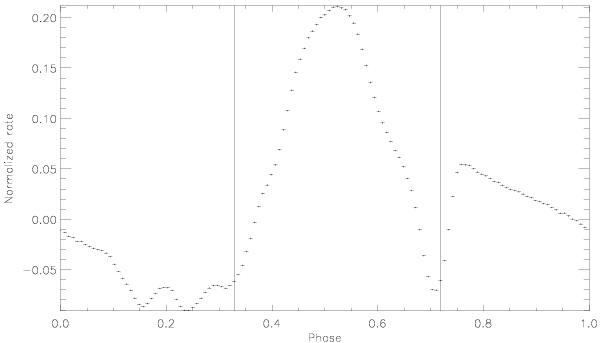
Reference pulse profile of 4U 0115 + 63 extracted from observation (b). Data are from the PCA (energy range 8-10.5 keV). The pulse profile has been linearly scaled to have zero average and unitary standard deviation. The two vertical solid lines enclose the phase interval used for the correlation analysis: 0.33–0.72 (the phase is shifted with respect to Fig. 3 for clarity’s sake).
Current usage metrics show cumulative count of Article Views (full-text article views including HTML views, PDF and ePub downloads, according to the available data) and Abstracts Views on Vision4Press platform.
Data correspond to usage on the plateform after 2015. The current usage metrics is available 48-96 hours after online publication and is updated daily on week days.
Initial download of the metrics may take a while.