Fig. 10
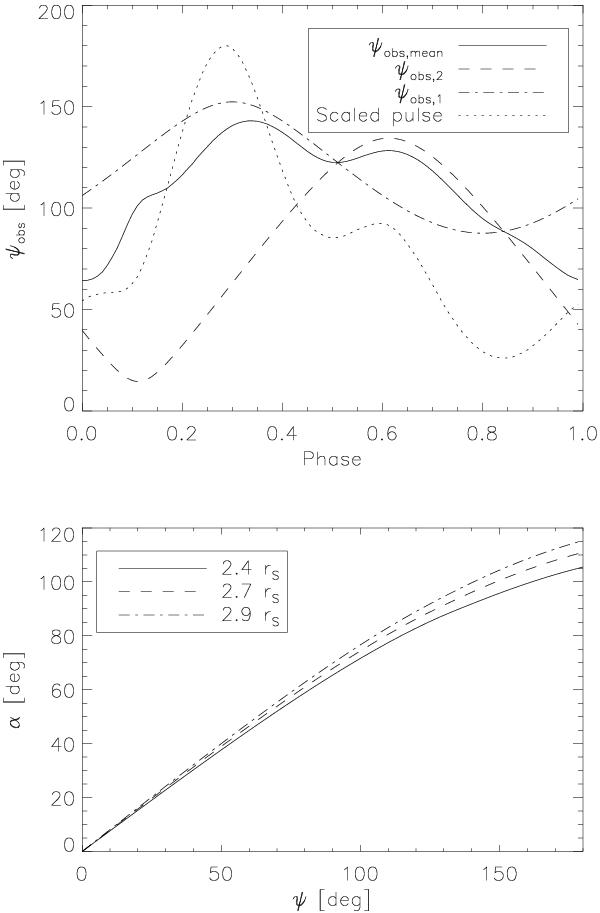
Upper panel: inclination angles of the columns with respect to the line of sight to the observer obtained by assuming an intrinsic beam pattern with N2 = 25. The dashed line represents the column that is farther away from the observer; the dot-dashed line, the other. The solid line is the average inclination angle of the two columns weighted for their relative flux measured at the location of the observer. The dotted line is the synthetic pulse profile, scaled to fit into the plot. Lower panel: relation between the angles ψ and α of Fig. A.1 for different locations from the center of the NS in units of the gravitational radius. The three locations correspond to the base of the accretion column, its midpoint, and the top of the column, respectively (calculated according to the geometry of the system defined in Sect. 4).
Current usage metrics show cumulative count of Article Views (full-text article views including HTML views, PDF and ePub downloads, according to the available data) and Abstracts Views on Vision4Press platform.
Data correspond to usage on the plateform after 2015. The current usage metrics is available 48-96 hours after online publication and is updated daily on week days.
Initial download of the metrics may take a while.