Fig. 9
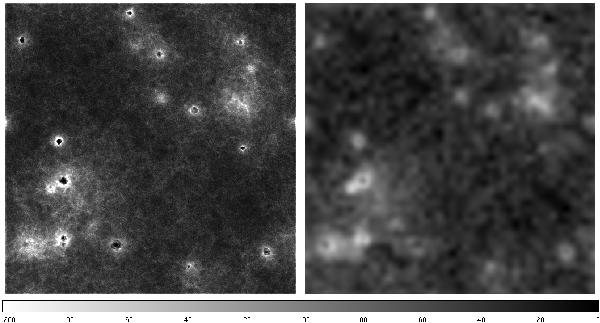
Maps of δTb at z = 11.05. The slice is 200 h-1 Mpc on a side and has a thickness of 2 h-1 Mpc. The scale, in units of mK, is linear. The left panel shows our simulated data cube at full resolution. The right panel shows the effect of instrumental noise and instrumental resolution. At that redshift, the latter is slightly larger than 2′.
Current usage metrics show cumulative count of Article Views (full-text article views including HTML views, PDF and ePub downloads, according to the available data) and Abstracts Views on Vision4Press platform.
Data correspond to usage on the plateform after 2015. The current usage metrics is available 48-96 hours after online publication and is updated daily on week days.
Initial download of the metrics may take a while.