Fig. 6
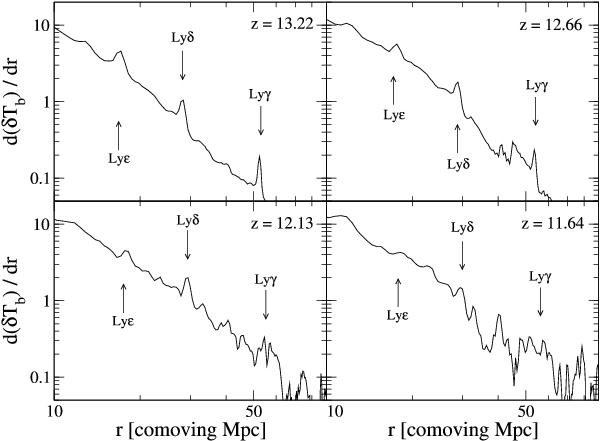
Gradient of the spherically averaged profiles of the differential brightness temperature around the first light source appearing at z = 14.06 in the 100 h-1 Mpc simulation. The four panels show the profile at different redshifts, from z = 13.22 to z = 11.64. At each redshift, arrows show the predicted position of the Lyϵ, Lyδ and Lyγ horizons. The Lyϵ and Lyδ horizons can be detected during a redshift interval Δz ~ 2. The fainter Lyγ horizon is visible for a shorter period Δz < 1.5.
Current usage metrics show cumulative count of Article Views (full-text article views including HTML views, PDF and ePub downloads, according to the available data) and Abstracts Views on Vision4Press platform.
Data correspond to usage on the plateform after 2015. The current usage metrics is available 48-96 hours after online publication and is updated daily on week days.
Initial download of the metrics may take a while.