Free Access
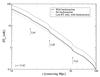
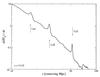
Fig. 4

Upper panel: spherically averaged profile of the differential brightness temperature at z = 13.42 around the first light source in the 100 h-1 Mpc simulation. The same notation is used as in Fig. 3. Note that we plot the opposite value of δTb. Lower panel: gradient of the spherically averaged profile.
This figure is made of several images, please see below:
Current usage metrics show cumulative count of Article Views (full-text article views including HTML views, PDF and ePub downloads, according to the available data) and Abstracts Views on Vision4Press platform.
Data correspond to usage on the plateform after 2015. The current usage metrics is available 48-96 hours after online publication and is updated daily on week days.
Initial download of the metrics may take a while.