Fig. 7
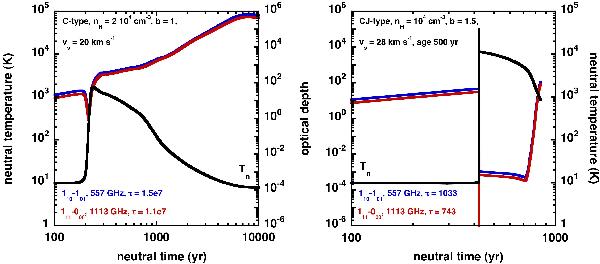
Evolution of the computed local optical depths of two transitions as a function of the flow time of the neutral fluid in our reference models, the stationary C-type (left panel) and non-stationary CJ-type (right panel). The o-H2O 110–101 (at 557 GHz) and p-H2O 111–000 (at 1113 GHz) lines are considered, and their optical depths are shown in blue and red, respectively. The corresponding total optical depths are indicated in the same colour code. The neutral temperature profile shown in black. The shock parameters are specified in each panel.
Current usage metrics show cumulative count of Article Views (full-text article views including HTML views, PDF and ePub downloads, according to the available data) and Abstracts Views on Vision4Press platform.
Data correspond to usage on the plateform after 2015. The current usage metrics is available 48-96 hours after online publication and is updated daily on week days.
Initial download of the metrics may take a while.