Fig. 6
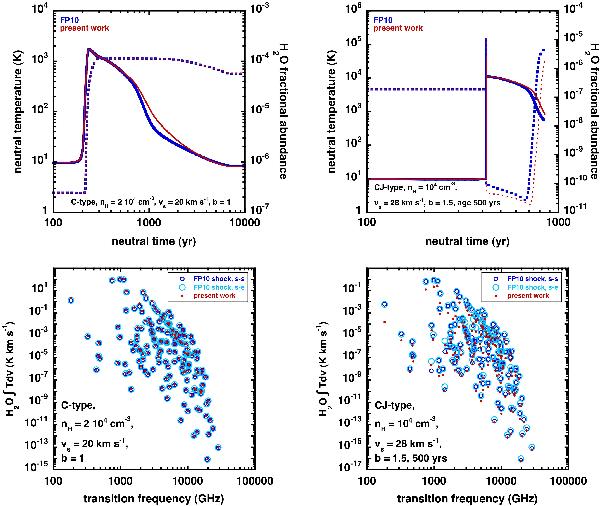
Upper panels: comparison between profiles obtained when the computation of the water line emission is internal to the shock code (steady-state approximation: blue curves) or external to the shock code (statistical equilibrium approximation: red curves); the temperature of the neutral fluid (continuous line) and the fractional abundance of water (dashed lines) are shown for our two reference, C-type (left-hand panel), and CJ-type (right-hand panel) shock models. In both cases, the shock parameters are displayed in the corresponding panels. Lower panels: integrated line intensities for all para-water transitions; steady-state approximation to the computation of the water emission (dark blue open circles); same shock model, but with the statistical-equilibrium approximation to the computation of the water emission (large light-blue open circles); present shock model, with the statistical-equilibrium assumption (small red filled circles).
Current usage metrics show cumulative count of Article Views (full-text article views including HTML views, PDF and ePub downloads, according to the available data) and Abstracts Views on Vision4Press platform.
Data correspond to usage on the plateform after 2015. The current usage metrics is available 48-96 hours after online publication and is updated daily on week days.
Initial download of the metrics may take a while.