Fig. 5
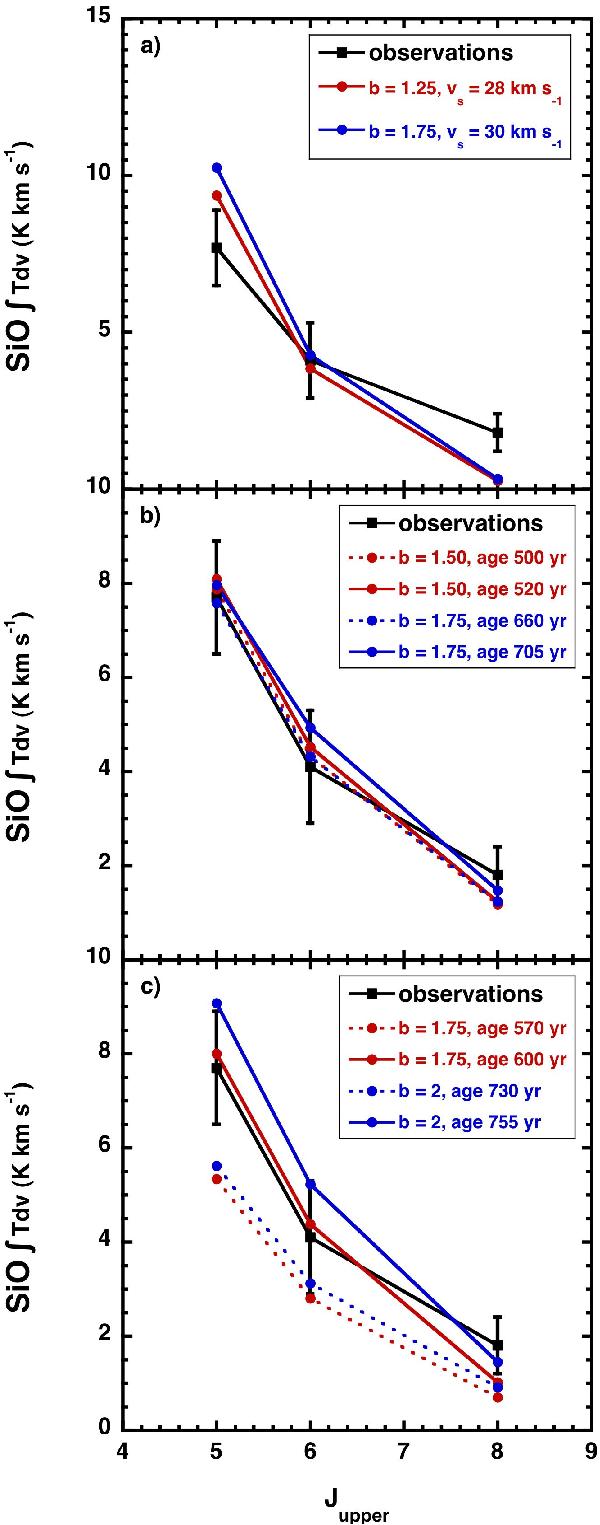
Examples of fits of the integrated intensities of our three transitions of SiO. On the y-axis is the integrated intensity (K km s-1), and on the x-axis is the rotational quantum number of the upper level of the transition. The observations are the black squares linked by the thick black lines, on all three panels. The 3σ errorbars are shown in the figure. The model results are displayed in colour (blue and red), with the indication of the specific shock parameters on each panel. a) C-type shock models: best fit shock parameters nH = 104 cm-3, no SiO initially in the grain mantles; b) CJ-type shock models: best fit shock parameters nH = 104 cm-3 and vs = 28 km s-1, with 1% of elemental silicon initially in the grain mantles, as SiO; c) CJ-type shock models: best fit shock parameters nH = 104 cm-3 and vs = 30 km s-1, with 10% of the silicon initially in the grain mantles as SiO.
Current usage metrics show cumulative count of Article Views (full-text article views including HTML views, PDF and ePub downloads, according to the available data) and Abstracts Views on Vision4Press platform.
Data correspond to usage on the plateform after 2015. The current usage metrics is available 48-96 hours after online publication and is updated daily on week days.
Initial download of the metrics may take a while.