Fig. 3
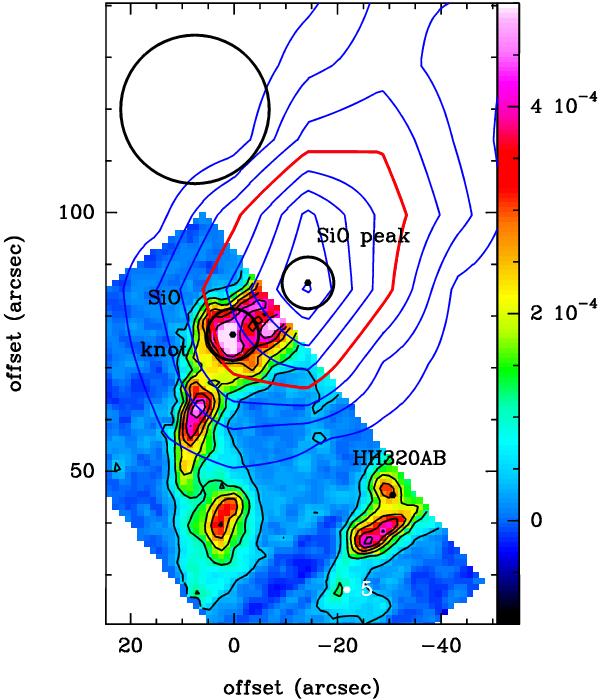
Upper internal part of the BHR71 outflow. The background map is the same as in Fig. 1. The SiO (5–4) contours, which are overlaid in a dark blue colour, correspond to levels of 6 to 30σ, in steps of 3σ, for an integration between − 10 and 60 km s-1. The half-maximum, 15σ contour is displayed in red. The associated beam size is indicated in the upper left corner. Our SiO (5 − 4) coverage is actually wider than the field displayed in this figure.
Current usage metrics show cumulative count of Article Views (full-text article views including HTML views, PDF and ePub downloads, according to the available data) and Abstracts Views on Vision4Press platform.
Data correspond to usage on the plateform after 2015. The current usage metrics is available 48-96 hours after online publication and is updated daily on week days.
Initial download of the metrics may take a while.