Fig. 2
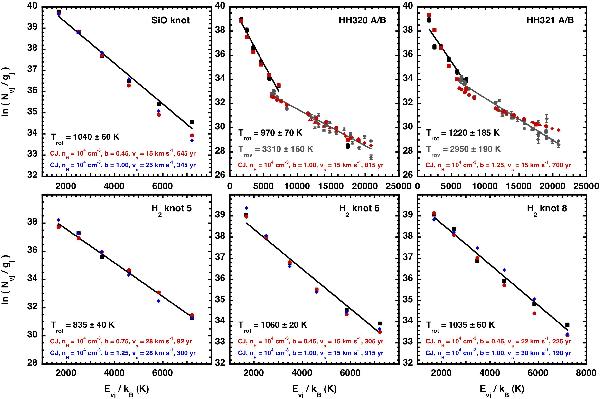
The H2 excitation diagrams observed for each position indicated in Fig. 1, in black (pure rotational lines), and grey (rovibrational lines, when available). The data were corrected for extinction, using AV = 2 from Giannini et al. (2004). The inferred rotational temperatures are indicated in black, and the rovibrational temperatures, in grey. The best-fitting model results are also shown in each case, in blue and/or red symbols. The shock parameters are given in each panel in the corresponding colour.
Current usage metrics show cumulative count of Article Views (full-text article views including HTML views, PDF and ePub downloads, according to the available data) and Abstracts Views on Vision4Press platform.
Data correspond to usage on the plateform after 2015. The current usage metrics is available 48-96 hours after online publication and is updated daily on week days.
Initial download of the metrics may take a while.