Fig. 1
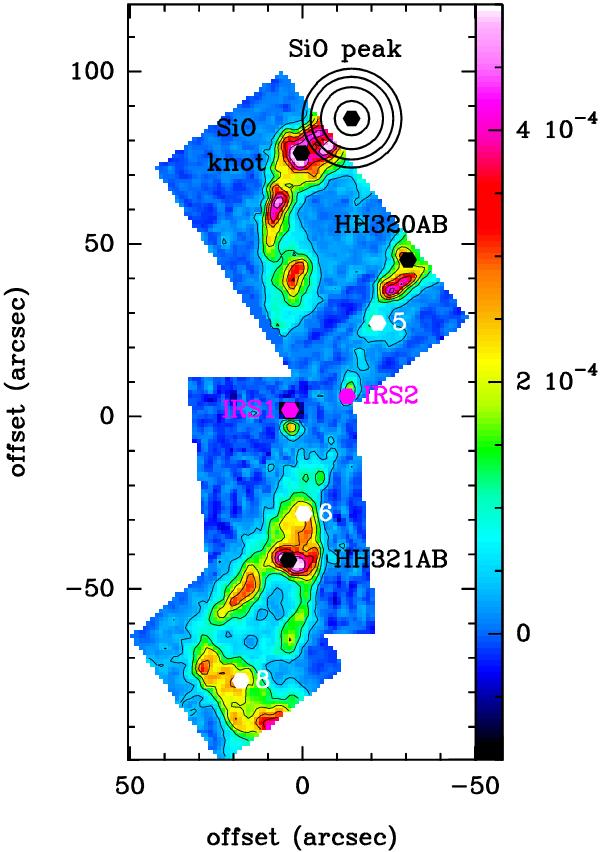
The internal parts of the BHR71 outflow as observed by Spitzer in the H2 0–0 S(5) transition (Neufeld et al. 2009); the colour scale unit is erg cm-2 s-1 sr-1. The contours correspond to the levels of 3, 9, 15, 21, 27, and 33σ. The pink hexagons give the positions of the IRS1 and IRS2 sources as determined by Bourke et al. (2001). The positions of the Herbig-Haro objects HH320AB and HH321AB are plotted in black as well as those of the SiO peak (referring to the point of maximum SiO (5–4) emission, see Sect. 3), and of the SiO knot, which was chosen to perform our simultaneous fit of H2 and SiO emission, and also to make predictions of water emission. The other emission knots that were analysed are plotted in white (knots 5, 6, and 8, following the labelling of Giannini et al. 2004). Around the SiO-peak, four radii are displayed, corresponding to 5, 9, 12, and 14.4′′. The first represents the size of our region of analysis. The latter three correspond to the beam of the APEX telescope for the SiO (8−7), (6−5) and (5−4) transitions, respectively; see text.
Current usage metrics show cumulative count of Article Views (full-text article views including HTML views, PDF and ePub downloads, according to the available data) and Abstracts Views on Vision4Press platform.
Data correspond to usage on the plateform after 2015. The current usage metrics is available 48-96 hours after online publication and is updated daily on week days.
Initial download of the metrics may take a while.