Fig. 8
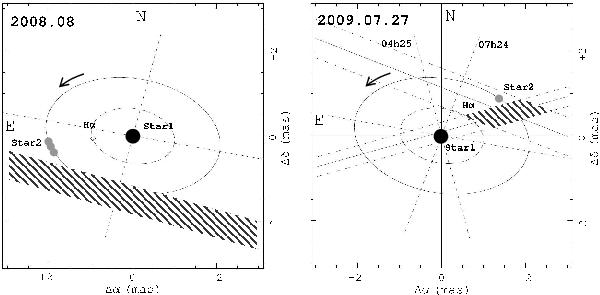
Expected configuration of the υ Sgr system at the time of the interferometric observations compared with the best location of the bulk Hα photocenter inferred from the differential phase analysis. The visual orbit of the couple star_1–star_2 is computed using the spectroscopic orbit of KHY and adopting the inclination and the position angle of the node from NBC. The orbit of the bulk of the Hα emission is shown following the spectroscopic orbit proposed by KHY. The S1S2 projected baselines at the time of the observations are also represented (dashed lines). The diagonal zones represent the constraints on the localization of the core of the Hα line imposed by the differential phase measurements. The hatched drawing zone for the 2009 observations takes into account the two measurements at different baseline orientations, while the single 2008 observation is not restrictive enough to provide tight constraints.
Current usage metrics show cumulative count of Article Views (full-text article views including HTML views, PDF and ePub downloads, according to the available data) and Abstracts Views on Vision4Press platform.
Data correspond to usage on the plateform after 2015. The current usage metrics is available 48-96 hours after online publication and is updated daily on week days.
Initial download of the metrics may take a while.