Fig. 7
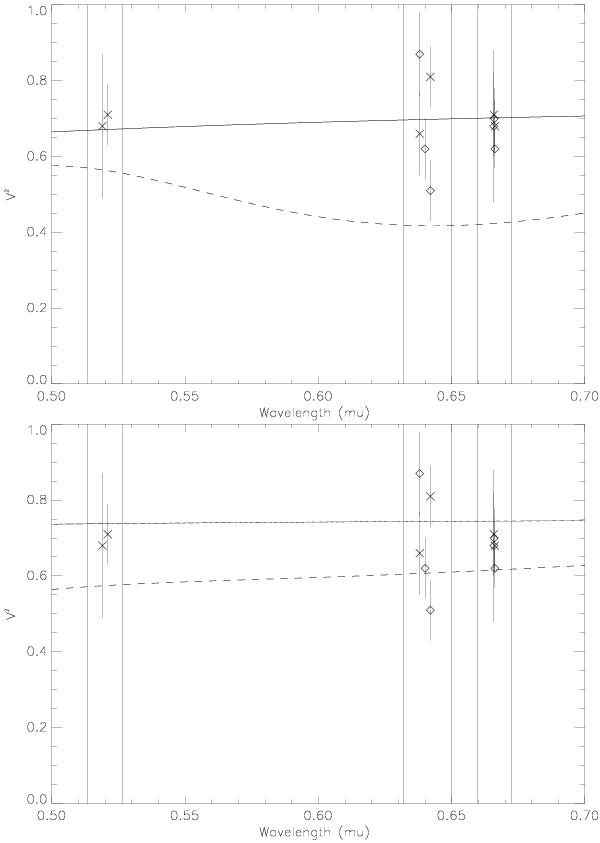
Expected interferometric signal corresponding to the configuration of the system of υ Sgr during the 2008 interferometric observations applying the parameters from (Koubský et al. 2006; Netolický et al. 2009). Upper panel: the flux ratio of the component is 10. Lower panel: the flux ratio of the component is 100. The solid line represents the S1S2 short baseline and the dashed line the W1W2 long baseline. The vertical lines define the spectral bandpass used for the V2 measurements described in Sect. 2.1.2. The measurements are shown as crosses with error bars (S1S2 measurements) and diamonds (W1W2 measurements).
Current usage metrics show cumulative count of Article Views (full-text article views including HTML views, PDF and ePub downloads, according to the available data) and Abstracts Views on Vision4Press platform.
Data correspond to usage on the plateform after 2015. The current usage metrics is available 48-96 hours after online publication and is updated daily on week days.
Initial download of the metrics may take a while.