Fig. 6
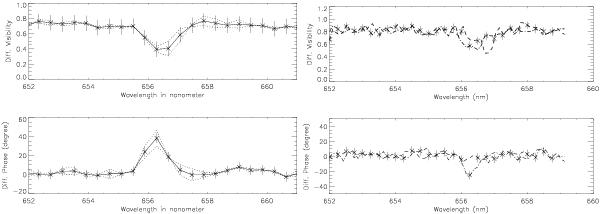
S1S2 34m baseline differential visibilities and phases of υ Sgr through the Hα line in August 2008 at Φorb = 0.06 (left) and on 27th of July 2009 Φorb = 0.65 (right). The 2008 data recorded in five day intervals with similar projected baselines agree well within error bars (dotted lines). The bin size is 0.8 nm in 2008 and in 2009 (4 h 25 baseline: dashed line; 7 h 24 baseline: dash-dotted line). Note the opposite direction of the phase signal between the two epochs.
Current usage metrics show cumulative count of Article Views (full-text article views including HTML views, PDF and ePub downloads, according to the available data) and Abstracts Views on Vision4Press platform.
Data correspond to usage on the plateform after 2015. The current usage metrics is available 48-96 hours after online publication and is updated daily on week days.
Initial download of the metrics may take a while.