Fig. 5
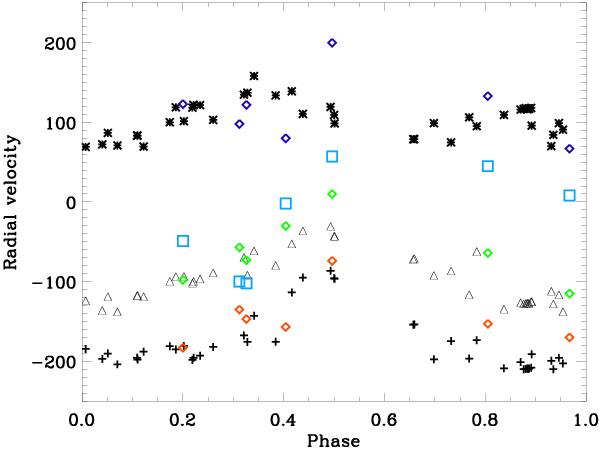
Radial velocities of the V (violet diamonds) and R peaks (red diamonds), the absorption component (green diamonds) and the dip of the differential visibilities (blue squares) in the Hα line. The Harmanec et al. (1996) velocities are shown for comparison (V peaks represented by stars, R peaks by crosses and absorption components by triangles).
Current usage metrics show cumulative count of Article Views (full-text article views including HTML views, PDF and ePub downloads, according to the available data) and Abstracts Views on Vision4Press platform.
Data correspond to usage on the plateform after 2015. The current usage metrics is available 48-96 hours after online publication and is updated daily on week days.
Initial download of the metrics may take a while.