Free Access
Fig. 1
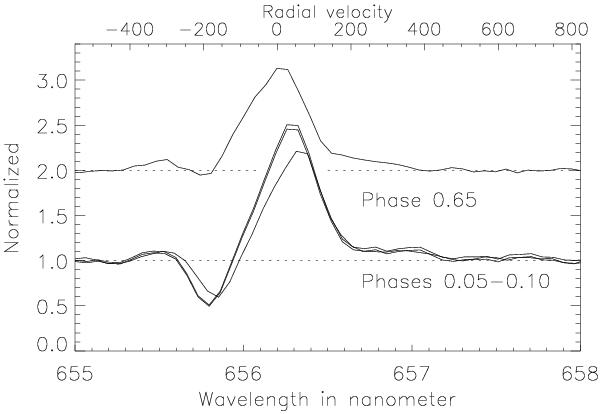
Hα profiles of υ Sgr as measured by the VEGA spectrograph (R = 5000). The shape of the lines recorded in 2008 looks very similar to the 2005 ones for phase 0 − 0.1 (Koubský et al. 2006).
Current usage metrics show cumulative count of Article Views (full-text article views including HTML views, PDF and ePub downloads, according to the available data) and Abstracts Views on Vision4Press platform.
Data correspond to usage on the plateform after 2015. The current usage metrics is available 48-96 hours after online publication and is updated daily on week days.
Initial download of the metrics may take a while.