Free Access
Fig. 1
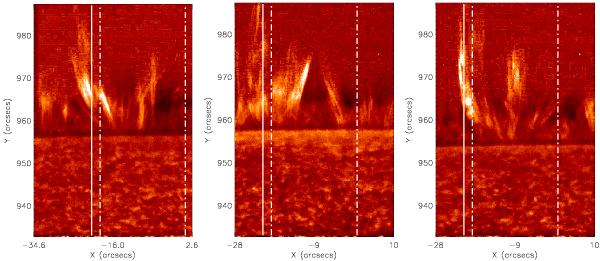
SOT Ca ii images showing spicules taken from left to right on 2009 April 28 at 16:24 UT, on April 29 at 02:24 UT and 03:28 UT. The overplotted solid line indicates the position of the SUMER slit, while the dashed-dotted lines indicate the EIS raster FOV.
This figure is made of several images, please see below:
Current usage metrics show cumulative count of Article Views (full-text article views including HTML views, PDF and ePub downloads, according to the available data) and Abstracts Views on Vision4Press platform.
Data correspond to usage on the plateform after 2015. The current usage metrics is available 48-96 hours after online publication and is updated daily on week days.
Initial download of the metrics may take a while.