Fig. 9
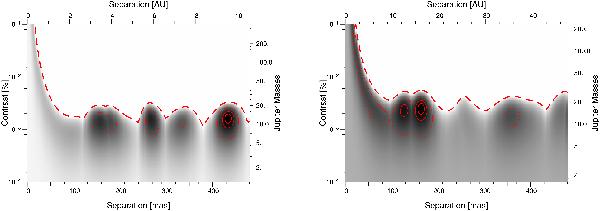
χ2 maps for target HD 92945 (left panel) and HD 141569 (right panel). The solid curves correspond to the isocontours at min(χ2)+1; +4; and +9 (eg. one, two, and three sigmas contours). Multiple minimums are present (false detections). The 5σ detection limits are, averaged over the separation, 2.5 × 10⁻³ and 4.6 × 10⁻³ (dashed curve). The right vertical axis was obtained assuming a linear fit of DUSTY evolutionarily models.
Current usage metrics show cumulative count of Article Views (full-text article views including HTML views, PDF and ePub downloads, according to the available data) and Abstracts Views on Vision4Press platform.
Data correspond to usage on the plateform after 2015. The current usage metrics is available 48-96 hours after online publication and is updated daily on week days.
Initial download of the metrics may take a while.