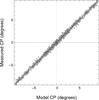
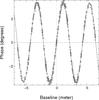
Fig. 6

Left panel: measured closure phase as a function of model closure phase assuming the best-fit binary parameters. The rms error between the model and the measurement is 0.28 degrees. Right panel: phase obtained by least square inversion of the closure phase to phase matrix, plotted as a function of the projected baseline (perpendicular to the binary orientation; hence the sinusoidal curve).
Current usage metrics show cumulative count of Article Views (full-text article views including HTML views, PDF and ePub downloads, according to the available data) and Abstracts Views on Vision4Press platform.
Data correspond to usage on the plateform after 2015. The current usage metrics is available 48-96 hours after online publication and is updated daily on week days.
Initial download of the metrics may take a while.