Fig. 5
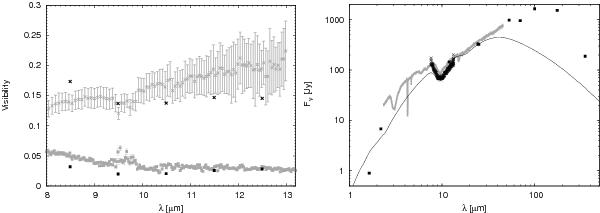
Left: comparison of the best-fit Robitaille envelope model (black crosses 40 m baseline, black rectangulars 90 m baseline) for the visibilities of NGC 2264 IRS 1 with the MIDI visibilities (gray rectangulars 90 m baseline, gray crosses 40 m baseline). Right: comparison of the best-fit Robitaille model (black line) for the spectrum of NGC 2264 IRS 1 with the ISO spectrum (gray line), the MIDI spectrum (dark gray crosses), and the data points from Table 1 (black rectangulars).
Current usage metrics show cumulative count of Article Views (full-text article views including HTML views, PDF and ePub downloads, according to the available data) and Abstracts Views on Vision4Press platform.
Data correspond to usage on the plateform after 2015. The current usage metrics is available 48-96 hours after online publication and is updated daily on week days.
Initial download of the metrics may take a while.