Fig. 3
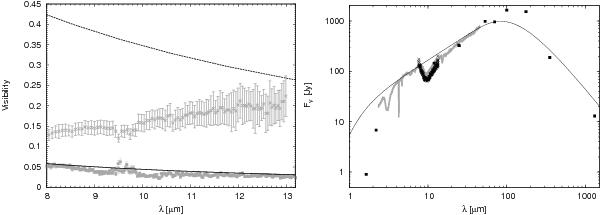
Left: comparison of the best-fit temperature-gradient model to the visibilities of NGC 2264 IRS 1 with the model parameters described in Sect. 3.2 (crosses for the 40 m baseline, rectangulars for the 90 m baseline). The resulting modeled visibility for the 40 m baseline is shown by the black dashed line, the one for the 90 m baseline by the black solid line. Right: comparison of the SED of our best-fit temperature-gradient model (black line) described in Sect. 3.2 with the ISO spectrum (gray line) of NGC 2264 IRS 1. The MIDI spectrum is shown with black crosses, all other measurements from Table 1 are shown with black rectangulars.
Current usage metrics show cumulative count of Article Views (full-text article views including HTML views, PDF and ePub downloads, according to the available data) and Abstracts Views on Vision4Press platform.
Data correspond to usage on the plateform after 2015. The current usage metrics is available 48-96 hours after online publication and is updated daily on week days.
Initial download of the metrics may take a while.