Fig. 4
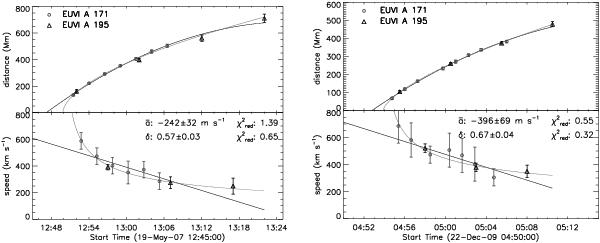
Kinematics of two fast coronal waves observed with STEREO-A/EUVI (left: 2007 May 19; right: 2009 Dec. 22). The plots show the deprojected distance d of the leading edges of the wavefronts from the extrapolated radiant point (upper half of the plots), and the corresponding speeds v (lower half), both as a function of time t. Also shown are 2nd degree polynomial (black line) and power-law fits (grey line), and the corresponding mean acceleration  and the power-law index δ is indicated. To the right of and δ, the reduced chi-squared values
  for the polynomial and power-law fit is given, respectively. Note the pronounced deceleration of the waves, and the fact that the power-law provides a better fit than the polynomial.
Current usage metrics show cumulative count of Article Views (full-text article views including HTML views, PDF and ePub downloads, according to the available data) and Abstracts Views on Vision4Press platform.
Data correspond to usage on the plateform after 2015. The current usage metrics is available 48-96 hours after online publication and is updated daily on week days.
Initial download of the metrics may take a while.