Fig. 1
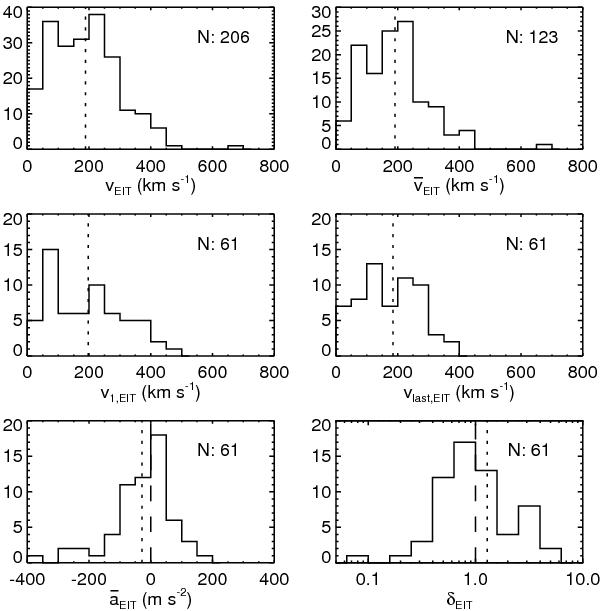
Histograms of all measured EIT wave speeds vEIT, the mean speeds  , the initial speeds v1,EIT, the final speeds vlast,EIT, the mean acceleration
  , and the power-law index δEIT, as derived from the catalog of Thompson & Myers (2009). The dotted vertical lines shows the mean values of the distributions, and N indicates the total number of individual values contained in each distribution. The dashed vertical lines indicate constant speeds with
  and δEIT = 1.
Current usage metrics show cumulative count of Article Views (full-text article views including HTML views, PDF and ePub downloads, according to the available data) and Abstracts Views on Vision4Press platform.
Data correspond to usage on the plateform after 2015. The current usage metrics is available 48-96 hours after online publication and is updated daily on week days.
Initial download of the metrics may take a while.