Fig. 7
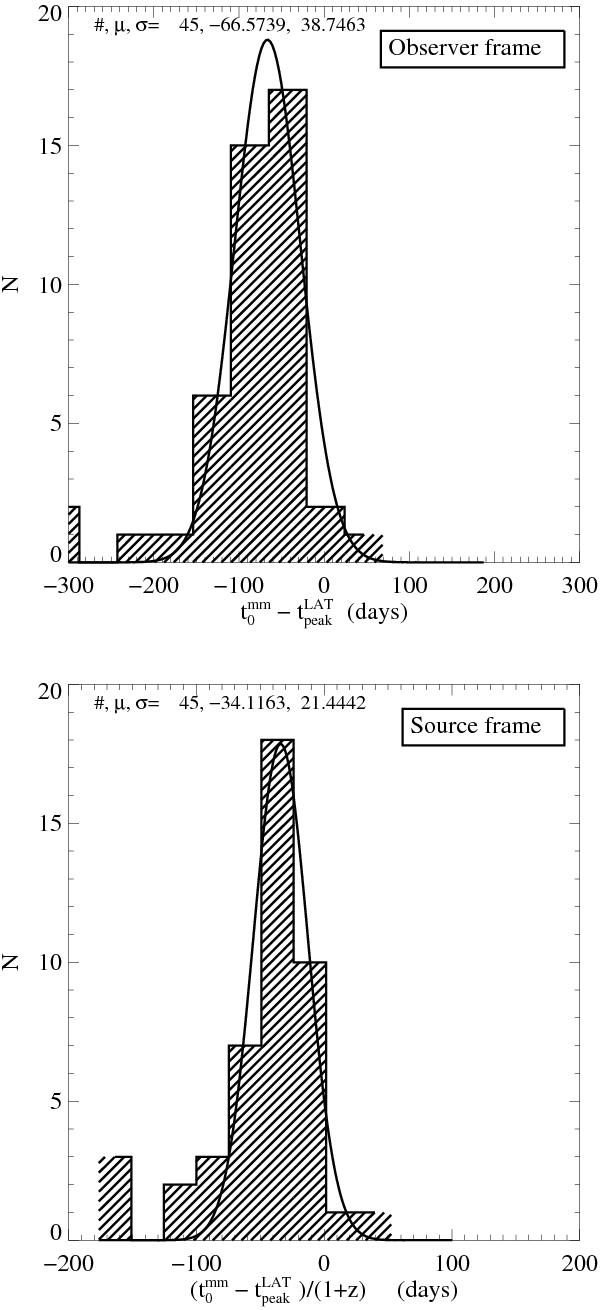
Top panel: the distribution of the observed delays between the beginning of a mm flare ( ) and the peak in the 1FGL light curves (
 ). The mean observed delay is about 70 days, with radio leading the γ-rays. The delays for each individual source have also been estimated in the source frame and the distribution is shown in the bottom panel. The mean value of the delay in the source frame is roughly one month.
Current usage metrics show cumulative count of Article Views (full-text article views including HTML views, PDF and ePub downloads, according to the available data) and Abstracts Views on Vision4Press platform.
Data correspond to usage on the plateform after 2015. The current usage metrics is available 48-96 hours after online publication and is updated daily on week days.
Initial download of the metrics may take a while.