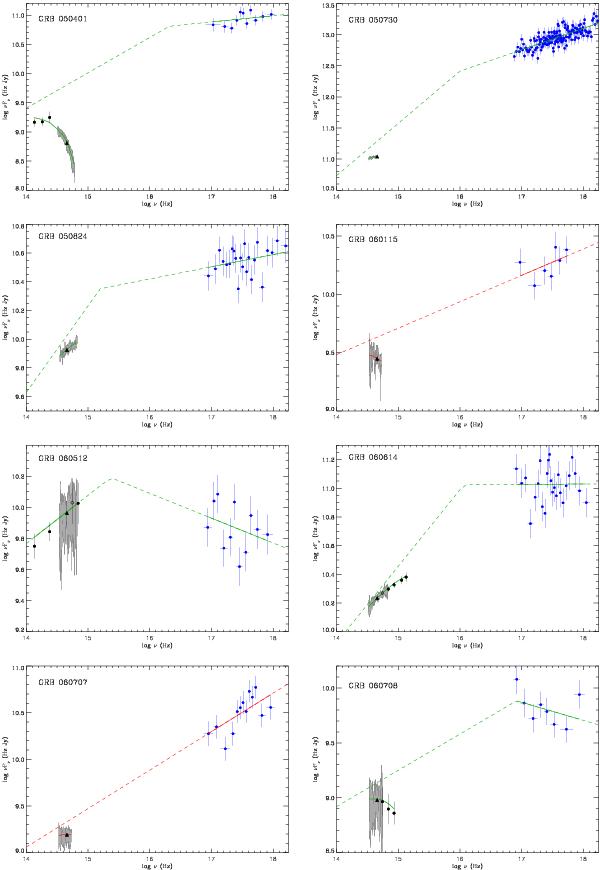
Fig. A.1

Afterglow SEDs of the spectroscopic GRB sample in νFν and ν space. In each figure, we plot the best fit extinguished (solid lines) and extinction corrected spectral model (dashed lines). The grey curve represents the optical spectrum. The X-ray spectra are indicated by blue points. The black triangle corresponds to acquisition camera photometry used for scaling the SED. Black open circles are not included in the spectral fitting because of the optical spectrum wavelength coverage in that region while solid circles represent the data points included in the SED modeling. The red curve shows the best fit single power-law model and the green curve illustrates the broken power-law model.
Current usage metrics show cumulative count of Article Views (full-text article views including HTML views, PDF and ePub downloads, according to the available data) and Abstracts Views on Vision4Press platform.
Data correspond to usage on the plateform after 2015. The current usage metrics is available 48-96 hours after online publication and is updated daily on week days.
Initial download of the metrics may take a while.


