Fig. 7
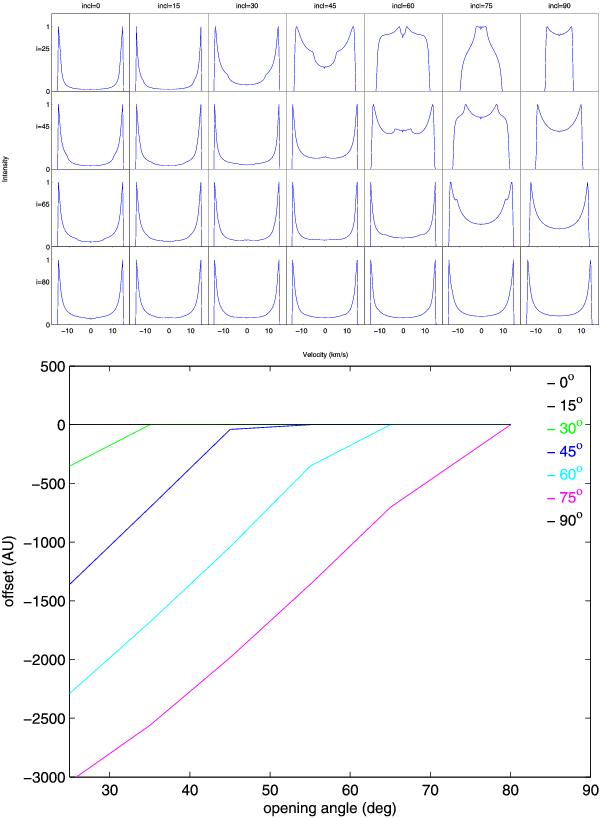
Model calculations for the case of isotropic outflow of 15 km s-1 with equatorial distribution. The top panel shows the spectra calculated for inclinations of 0°, 15°, 30°, 45°, 60°, 75°, 90° from the plane of the sky. For each inclination the spectra are shown for 25°, 45°, 65° and 80° opening angle from the equatorial plane. The bottom panel displays the offset between the blue shifted and red shifted regions in the plane of the sky. The negative sign indicates that the masers are reversed in the plane of the sky compared to those located in a narrow region in the polar axis.

Current usage metrics show cumulative count of Article Views (full-text article views including HTML views, PDF and ePub downloads, according to the available data) and Abstracts Views on Vision4Press platform.
Data correspond to usage on the plateform after 2015. The current usage metrics is available 48-96 hours after online publication and is updated daily on week days.
Initial download of the metrics may take a while.