Fig. 3
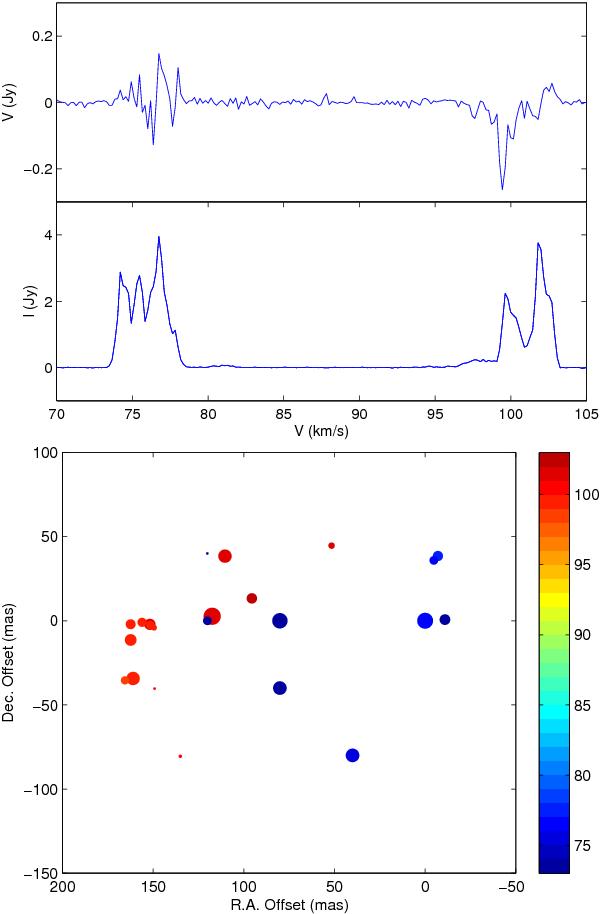
Top panel: total power and the stokes V spectra of the OH maser region of OH 37.1-0.8. The V spectrum is shown after removing the residual scaled down of the stokes I. Bottom panel: the OH maser region of OH 37.1-0.8. The offset positions are with respect to the maser reference feature 7. The maser spots are color-coded according to their radial velocity. The size of the spots is scaled logarithmically according to their flux density.
Current usage metrics show cumulative count of Article Views (full-text article views including HTML views, PDF and ePub downloads, according to the available data) and Abstracts Views on Vision4Press platform.
Data correspond to usage on the plateform after 2015. The current usage metrics is available 48-96 hours after online publication and is updated daily on week days.
Initial download of the metrics may take a while.