Fig. 2
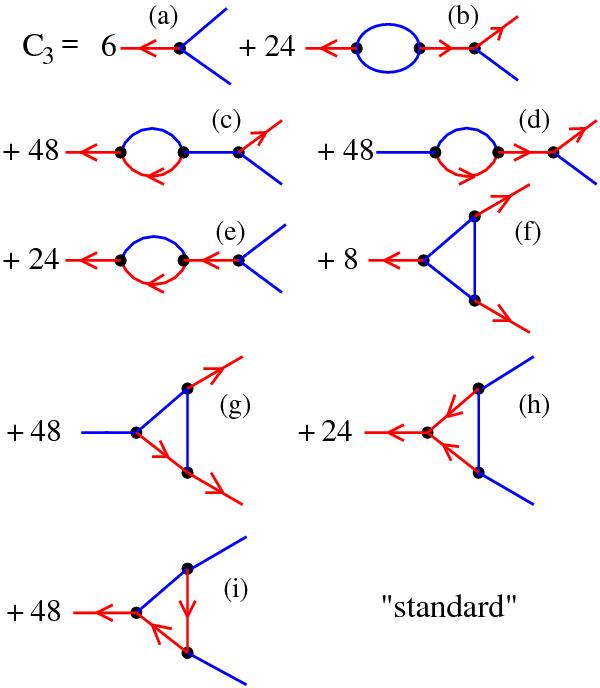
Diagrams associated with the standard perturbation theory as obtained from a
path-integral formalism up to 1-loop order for the three-point
correlation C3. Although they are different from those
obtained by the standard approach, their sum at each order is identical to the sum
of the standard diagrams of the same order
over PL(k). The lines are the linear
two-point correlation CL (blue solid line) and the
linear response RL (red solid line with an arrow). The
black dots are the three-leg vertex Ks
that enters the quadratic term of the equation of motion. The numbers are the
multiplicity factors of each diagram. The tree-order diagram a) gives
Eq. (39), for the density
bispectrum, while the 1-loop diagrams b), ..., i), give
the contribution of order  .
.
Current usage metrics show cumulative count of Article Views (full-text article views including HTML views, PDF and ePub downloads, according to the available data) and Abstracts Views on Vision4Press platform.
Data correspond to usage on the plateform after 2015. The current usage metrics is available 48-96 hours after online publication and is updated daily on week days.
Initial download of the metrics may take a while.