Fig. 6
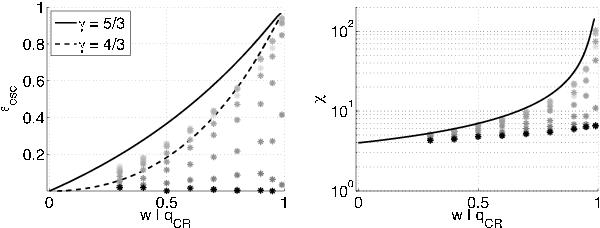
Left panel: escape CR energy versus w and qCR. Right panel: compression ratio χ versus w and qCR (Tycho’s case). The Rankine-Hugoniot black curve corresponds to Mach number M0 = 500. Intensity of the data point is inversely proportional to the values of diffusion coefficient κCR, i.e. black asterisks correspond to κCR = 1024 cm2 s-1, light grey ones correspond to κCR = 1027 cm2 s-1.
Current usage metrics show cumulative count of Article Views (full-text article views including HTML views, PDF and ePub downloads, according to the available data) and Abstracts Views on Vision4Press platform.
Data correspond to usage on the plateform after 2015. The current usage metrics is available 48-96 hours after online publication and is updated daily on week days.
Initial download of the metrics may take a while.