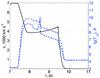
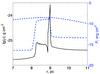
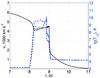
Fig. 2
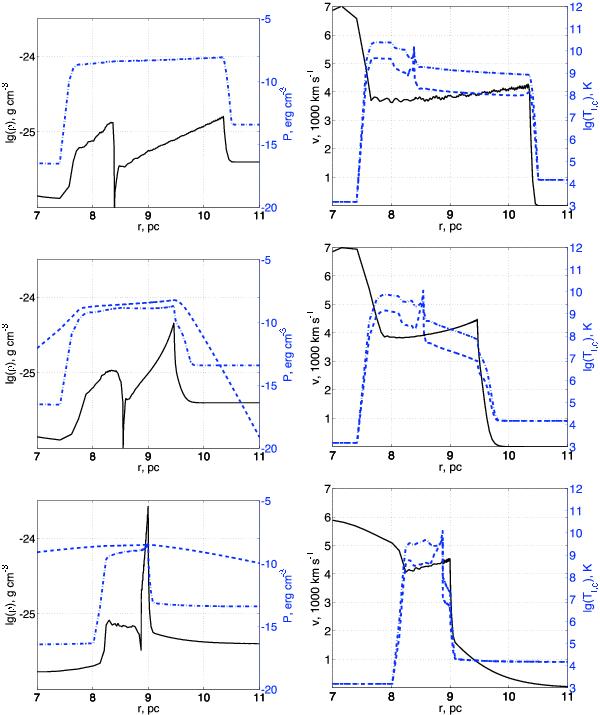
HD profiles for the SNR models at t = 1000 years with ρCSM = 4 × 10-26 g cm-3. Top row shows the simulation with qCR = 0.0, middle row – qCR = 0.7, κCR = 1025 cm2 s-1; bottom row – qCR = 0.99, κCR = 1026 cm2 s-1. Left panels: density (black solid line, scale at the left-hand side), ion pressure (blue dash-dotted line, scale at the right-hand side), and CR pressure (blue dashed line, scale at the right-hand side). Right panels: velocity profile (black solid line, scale at the left-hand side), electron temperature profiles (blue dashed line, scale at the right-hand side), and ion temperature profiles (dashed-dotted line, scale at the right-hand side).
Current usage metrics show cumulative count of Article Views (full-text article views including HTML views, PDF and ePub downloads, according to the available data) and Abstracts Views on Vision4Press platform.
Data correspond to usage on the plateform after 2015. The current usage metrics is available 48-96 hours after online publication and is updated daily on week days.
Initial download of the metrics may take a while.