Free Access
Fig. 5
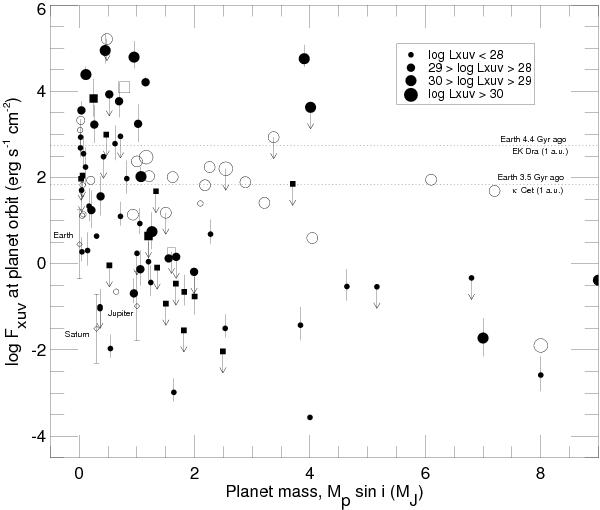
Distribution of planetary masses (Mpsini) with XUV flux at the planet orbit. Symbols as in Fig. 4 Error bars indicate the limits in EUV flux calculated with the models. Dotted lines indicate the X-ray flux of the younger Sun at 1 au. Note that mass loss rates increase with the XUV flux.
Current usage metrics show cumulative count of Article Views (full-text article views including HTML views, PDF and ePub downloads, according to the available data) and Abstracts Views on Vision4Press platform.
Data correspond to usage on the plateform after 2015. The current usage metrics is available 48-96 hours after online publication and is updated daily on week days.
Initial download of the metrics may take a while.